")
This blog post accompanies a new toolkit developed by the Urban Institute as part of the Switchboard program: Data-Driven State Refugee Programs: Lessons from the field on managing, analyzing, and using data to improve refugee programs.
The Office of Refugee Resettlement (ORR) recently delivered a series of webinar trainings on its updated ORR-6 report, which will go into effect in Fiscal Year (FY) 2020. During the webinar, ORR provided insight into how the data will be used at the federal level—for program oversight, tracking progress toward grantees’ annual goals, determining program utilization and enrollments to formulate Cash & Medical Assistance (CMA) allocations, and congressional budget justification.
It is helpful and motivating to understand and value how those requesting data will use it. But if you’re reporting data, it is also important to understand the value that the data has for you, your programs and clients.
So, how can States and partner agencies use the data required by the ORR-6? How do you transform data reporting requirements into data that aids learning and service improvement and enables you to understand and communicate results? If you already have a learning agenda in place for your ORR funded programs, consider how the data in the ORR-6 can help you gain knowledge about what you want to learn. If you don’t have a learning agenda in place, take some time to develop one. Some basic questions you probably have about your programs include:
- Is implementation of project activities on track? If not, why not?
- What is the quality of the services being provided? Are they timely? Are they being provided in accordance with relevant requirements or guidelines? Are they accessible to intended clients, regardless of demographic characteristics (e.g., sex, age, nationality, or education), and location? If not, why not?
- Did we see the outputs (products, goods, services and immediate results) that we expected during the reporting period? Is the project on track to meet targets? If not, why not?
- Did we achieve the outcomes we expected to see for clients? If not, why not?
- Were there any differences in outcomes for clients based on demographics (e.g., sex, age, nationality, or education), arrival date, project site (or implementing organization), case worker, or services received? If so, why?
- How does data across project sites (or implementing organizations) compare? What accounts for any differences or trends we see?
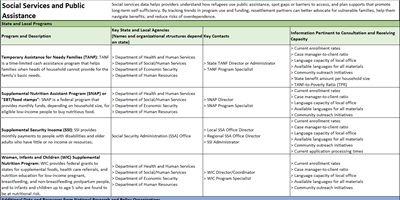
It may be helpful to map out the ORR-6 data points for each schedule in a table like the one below:

This exercise may help you examine how you could use the data, and help structure it for analysis, visualization, and reporting. It may also help you communicate the value of the data to partner organizations/grantees from whom you are requesting data, to foster their buy-in and support them in analyzing and using the data for service improvement. It could even be developed collaboratively with partners/grantees. Understanding the value of data, particularly when time and capacity is limited, has potential to improve both data use and data quality.
For more recommendations on how States can use ORR-6 data for learning and program improvement, see Data-Driven State Refugee Programs: Lessons from the field on managing, analyzing, and using data to improve refugee programs.